The Attribution Lie You Tell Yourself Every Quarter
Last-click attribution is the most common way B2B marketing teams measure content performance. It's also the measurement approach most likely to lead to the wrong content investment decisions. When the last action before a form fill gets 100% of the credit, the blog post read three months ago, the thought leadership article shared in a Slack channel, and the email nurture piece that moved the contact from cold to warm get exactly zero credit. Those content touches shaped the buyer's thinking — they just didn't happen to be the final click.
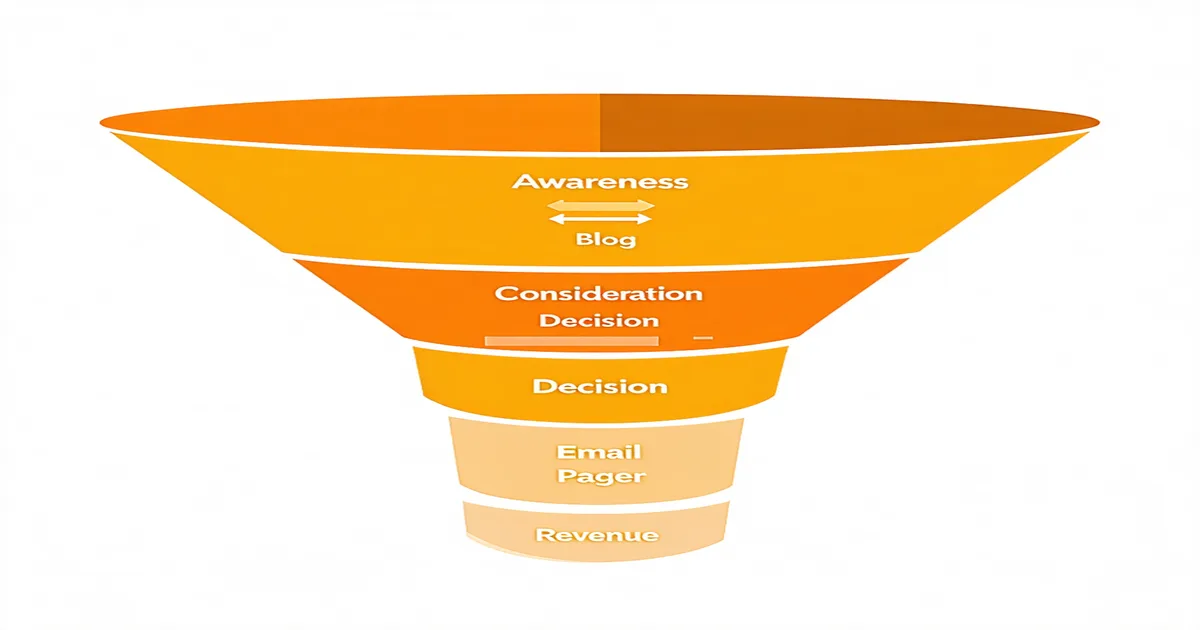
The practical consequence: last-click attribution systematically over-credits bottom-of-funnel, high-intent conversion content (demo request pages, pricing comparison pieces) and under-credits top-of-funnel content (thought leadership, problem-framing articles, educational resources). Teams that make content investment decisions based on last-click data predictably underinvest in awareness content and struggle to understand why their pipeline dried up two quarters later.
This is not a pitch for a specific attribution model. Every attribution model has blind spots. This is an argument for using attribution data in the right frame of reference — and understanding what it can and cannot tell you.
The Three Layers of Content Measurement
A practical B2B content measurement framework operates at three layers, each answering a different question. Conflating them — using consumption metrics to make pipeline claims, or using last-click revenue attribution to evaluate thought leadership — produces the wrong conclusions in both directions.
Layer 1: Consumption and reach
These metrics — page views, time on page, scroll depth, email open rates, click-through rates, content downloads — tell you whether anyone is reading what you're producing. They're necessary but not sufficient for ROI claims. A blog post with 8,000 views and high time-on-page is a signal that the topic resonates with your audience. It is not evidence that the piece moved pipeline. Both facts are true and important; conflating them leads to the "we have great organic traffic and terrible conversion" problem that plagues content programs at mid-market B2B companies.
Use consumption metrics to make content quality decisions: which topics attract the right ICP, which formats generate engagement, which pieces underperform despite strong distribution. These are editorial decisions, not ROI claims.
Layer 2: Lead and MQL influence
This is where content measurement starts connecting to the revenue conversation. An MQL who consumed three pieces of content before converting is a different signal than one who converted from a single paid ad click. Content-influenced MQL rate — the proportion of MQLs who had at least one meaningful content interaction before converting — is a metric that most CRM and marketing automation platforms can produce if the tracking is configured correctly.
A growing B2B company with a 25-person GTM team might target a content-influenced MQL rate of 40–60% as a reasonable baseline for a program that's been running for 12–18 months. That range is not a published benchmark — it's a reasonable expectation based on the nature of B2B buying cycles where research typically precedes vendor contact. Your specific number will depend on your go-to-market motion, ICP, and how aggressively you're distributing content to in-market buyers.
Track this monthly. When it drops, the question to ask is not "what happened to our content quality?" — it's "what happened to our content distribution?" Most drops in content-influenced MQL rate trace to distribution failures, not production failures.
Layer 3: Pipeline and revenue influence
This is the hardest layer and the one most vulnerable to attribution methodology fights. The honest position: you cannot perfectly attribute closed revenue to content. The buying decision that resulted in a signed contract was influenced by the sales rep's relationships, the timing of the buyer's internal budget cycle, competitive dynamics, the quality of the product demo, and yes, the content the buyer consumed over the prior six months. Claiming that a specific piece of content "drove" a specific closed deal is almost always an oversimplification.
What you can measure honestly is content's presence in the deal: which pieces appeared in buyer paths for closed-won deals versus closed-lost deals, which content types appear more often in fast deals versus slow deals, which topics are disproportionately represented in the paths of deals from your highest-value ICP segments. This analysis requires multi-touch attribution data and a CRM that tracks content touches at the contact level, not just the lead level.
The Sales Enablement Measurement Problem
Sales enablement content — one-pagers, battle cards, executive summaries — is particularly difficult to measure because it's used in-person or in direct email, not on the website where tracking pixels can fire. A rep who sends a one-pager to a champion and closes the deal two weeks later: the one-pager likely influenced the outcome, but it shows up in no attribution report anywhere.
We are not saying you should try to instrument rep behavior to capture every asset share — that's both technically complex and culturally counterproductive in most sales organizations. We are saying that measuring sales enablement ROI requires a different methodology: rep adoption rate (are they using the assets?), deal cycle analysis (do deals where reps self-report asset usage close faster?), and direct rep feedback (which assets are they reaching for, and which are they ignoring?).
Quarterly qualitative interviews with four or five reps will tell you more about the practical ROI of your sales enablement library than any attribution data will. The reps know which assets move conversations forward and which sit unused. Ask them.
Building the Content ROI Report
Most content teams are asked to prove ROI in a format — "here's the revenue this content generated" — that's both technically undeliverable and epistemically dishonest. The right frame for the executive audience is not "content generated $X in revenue" but "content contributed to $X in influenced pipeline, and here's the evidence."
A practical quarterly content ROI report for a B2B marketing team might include: top-performing pieces by funnel stage and engagement metric, content-influenced MQL rate for the quarter versus prior quarter, content appearances in the buyer paths of closed-won deals (by deal size segment), sales enablement asset adoption rate from CRM or rep survey, and the direct cost of producing the content compared against the pipeline value of influenced deals.
That last comparison — cost-per-influenced-opportunity — is often more persuasive to finance than any attribution percentage, because it's framed in the same terms as paid acquisition. If your content program is driving influenced opportunities at a lower cost per opportunity than paid channels, you have a clear case for investment. Build that case with honest numbers, not inflated attribution claims, and it will hold up under scrutiny.
When the Data Doesn't Support the Narrative
Sometimes the measurement exercise reveals that the content program is underperforming. Traffic isn't converting, content isn't appearing in buyer paths, sales teams aren't using the assets, and the cost per influenced opportunity is three times the paid channel cost. That's uncomfortable data, but it's useful data.
The correct response is not to find a different measurement approach that makes the numbers look better. It's to diagnose: is the ICP mismatch (content attracting the wrong readers), a distribution failure (content not reaching in-market buyers), a funnel stage gap (missing pieces at the stages where buyers evaluate), or a quality problem (content that doesn't earn the second click)? Each diagnosis points to a different fix. Obscuring the signal by choosing a more flattering attribution model just delays the fix and compounds the cost.